Dear Citizen Scientists,
We would like to thank you for your participation in the 2022 WaterBlitz!
The WaterBlitz is a co-created research project between DCU Water Institute and Citizen Scientists in Ireland in partnership with Earthwatch Europe. The aim of this long-term project is to investigate how public engagement can facilitate water restoration.
This year has seen the largest WaterBlitz yet with over 700 participants and 697 samples taken across Ireland.
We have analysed the data from samples you have collected and we are very happy to share the findings in this report.
Your contribution has helped us build an important picture of the condition of Ireland’s water bodies, in particular those that are never monitored. Your valuable effort provides data that can inform how this important resource can be protected into the future.
Prof Fiona Regan,
Water Institute Director
2022 WaterBlitz
Key Findings
Ireland’s largest WaterBlitz took place in
2022
108
community and water interest groups took part nationally
Freshwater samples tested in all
26
counties
73%
of participants believe they have the power to improve or maintain good water quality through citizen science
70%
of participants feel their contribution can help build greater understanding of water quality in Ireland
697
samples taken
720
participants over 4 days
40
of 46 EPA river catchments nationwide sampled
Who participated?
23
river/lake groups
13
environmental groups
20
Group Water Schemes
16
Tidy Towns groups
8
community groups
16
schools (8 primary, 7 post primary and one 3rd level)
6
swimming groups
4
kayaking/paddle boarding groups
1
angling group
1
sub aqua group
What types of waterbodies were sampled?
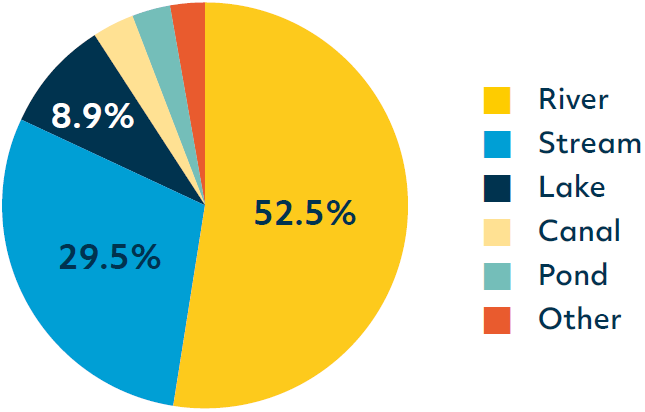
Figure 1. Variety and predominance of waterbody types sampled during the 2022 WaterBlitz. ‘Other’ includes springs, wells, wetlands and ditches.
What did we measure and why?
In this project we invited citizen scientists to use a simple tool to measure nitrate and phosphate levels in freshwater. Locations were chosen by the citizen scientists to determine if waterbodies are impacted by the presence of these nutrients. These measurements provided a snapshot in time of the water quality in the waterbodies sampled. These waterbodies drain a catchment, and so the measurements within the waterbody are affected by what is happening higher up within the catchment itself.
Water pollution can come from several sources within the catchment. Phosphates and nitrates can have different pathways to get to our water courses. When we fertilise our farmland, we put these plant nutrients of phosphates and nitrates onto the land surface. Phosphates tend to accumulate at the top of the soil, and so can be easily washed into streams and rivers by surface runoff. In some cases, high phosphates can also indicate the presence of domestic sewage. Nitrates are easily picked up by water as it moves through the soil, and so nitrates tend to find their way into rivers, lakes and streams through baseflow contributed by groundwater. Where nutrients are found to be present in freshwater in large amounts, ‘eutrophication’ can occur leading to an increase in the presence of algae and a reduction in the amount of oxygen in the water available for aquatic species.
While monitoring water quality, participants also noted the land use in the vicinity of the sampling site. Land use can have a direct effect on local waterbodies; for example where there is increased urbanisation (which increases surface runoff), agricultural activity (which may involve fertiliser use on the land), or diverse habitats along a river bank which can filter nutrients. Therefore land use can be helpful as an indicator of what the potential pathway for the nutrient might have been.
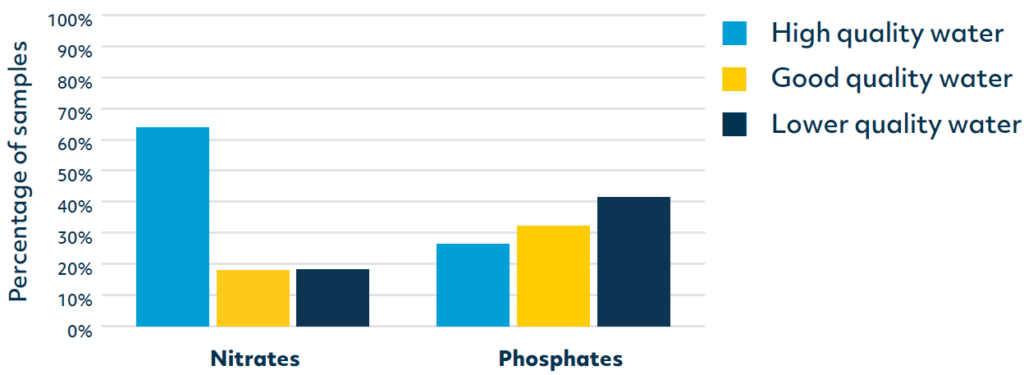
Figure 2. Levels of nitrates and phosphates recorded during the 2022 WaterBlitz.
The categories used for high, good and lower quality water are based on the criteria used by the EPA for categorising these nutrient levels. For nitrates (measured as nitrate-nitrogen), high quality is <0.9 mg/l NO3-N, good quality is <1.8 mg/l NO3-N, and lower quality is >1.8 mg/l NO3-N. For phosphates (measured as orthophosphate as phosphorous) high quality is <0.025 mg/l PO4-P, good quality is <0.035 mg/l PO4-P, and lower quality is >0.035 mg/l PO4-P. How this translates to the ranges used by Freshwater Watch is shown in the table below.
Table 1: Ranges used for graphs in this report.
| Lower quality water | Good quality water | High quality water | |
|
Phosphates (PO4-P, mg/l) |
0.05-0.1 0.1-0.2 0.2-0.5 0.5-1 |
0.02-0.05 | 0-0.02 |
|
Nitrates (NO3-N, mg/l) |
2-5 5-10 |
1-2 |
0-0.2 0.2-0.5 0.5-1.0 |
DCU Water Institute has carried out analytical validation in the laboratory of the kits by citizen scientists to ensure that the kits used record the nutrient values accurately. After data collection, we have cleaned the data, to ensure that the sample is plotting where you report that you have taken the test, and to check for any other anomalies in the data.
What does the data say?
From the data you gathered it was found that 82% of all waterbodies had high or good quality water when tested for nitrates, while this figure for phosphates was 59%. Ireland is committed to the Water Framework Directive, which requires us to have a minimum of ‘good water quality’ in all of our water resources by 2027.
1 in 10 sample locations recorded water quality of less than good. These were mostly in the southeast and south, with 51% of these being within counties Dublin and Cork. Many of the samples that recorded poor water quality were taken along multiple points of the same water body. For example, 6 samples which recorded poor quality of water were taken along the Delvin river in Dublin, while 4 samples with poor water quality were taken along the Tramore river in Cork, as it passes through an industrial estate south of the city.
From this work, we can see that there are still a lot of water bodies to protect and restore. Having local communities involved in monitoring and protecting their freshwater bodies is a key part of the Water Framework Directive.
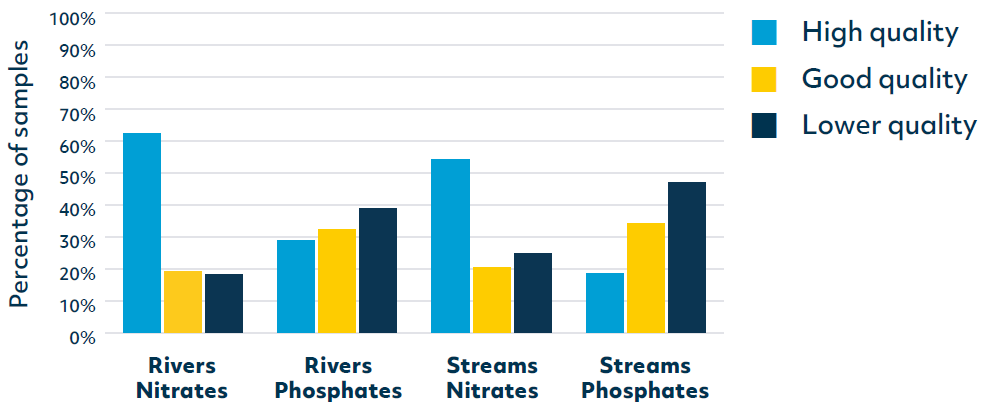
Figure 3. Levels of nitrates and phosphates recorded in rivers and streams in the 2022 WaterBlitz.
Participants were asked to record the freshwater body type from which they took the sample. The decision to mark a waterbody as a stream or a river was left to the discretion of the citizen scientist. We have not altered categorisation of the waterbody type for this report, as the local citizen scientist will have recorded what they deemed was most appropriate.
At waterbody level, 18% of river samples had high levels of nitrates indicative of lower water quality, while 39% of samples taken at rivers had levels of phosphates indicative of lower quality water. Because natural waters contain very low background levels of phosphates, any rise in phosphates can make a big difference and may cause increased algae growth. The higher levels of nutrients, and particularly phosphates, across the country is a cause for concern. In the most recent EPA report on water quality in Ireland, they identify a trend of increasing phosphate levels particularly in the south of Ireland.
Meanwhile, 25% of streams tested for nitrates, and 47% tested for phosphates also had lower quality water.
What type of landuse did you see?
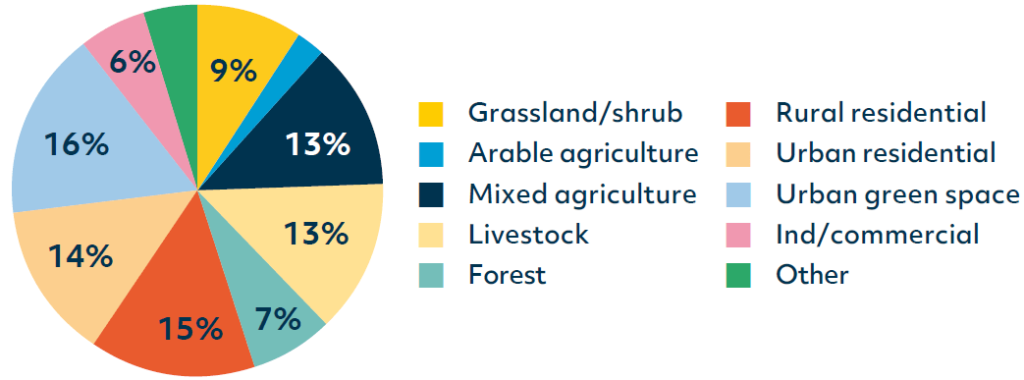
Figure 4. Land use recorded at sampling locations during the 2022 WaterBlitz.
Land use may influence nutrient occurrence. For the 2022 WaterBlitz, additional land use categories were introduced, such as rural residential and different types of agriculture – mixed, livestock and arable. It was found that 81% of waterbodies in agricultural locations (28% of sampling points) had high or good quality water when tested for nitrates, with 19% lower quality. Phosphate tests indicated just 50% of locations had high or good quality water, while 50% had lower quality water.
Urban green spaces and urban residential areas comprised 30% of sampling locations. Nitrate tests at these locations showed that 60% had high quality water while 20% had lower quality water. Testing for phosphates indicated that just 20% had high quality water while 38% also had lower quality water.
Catchments Map
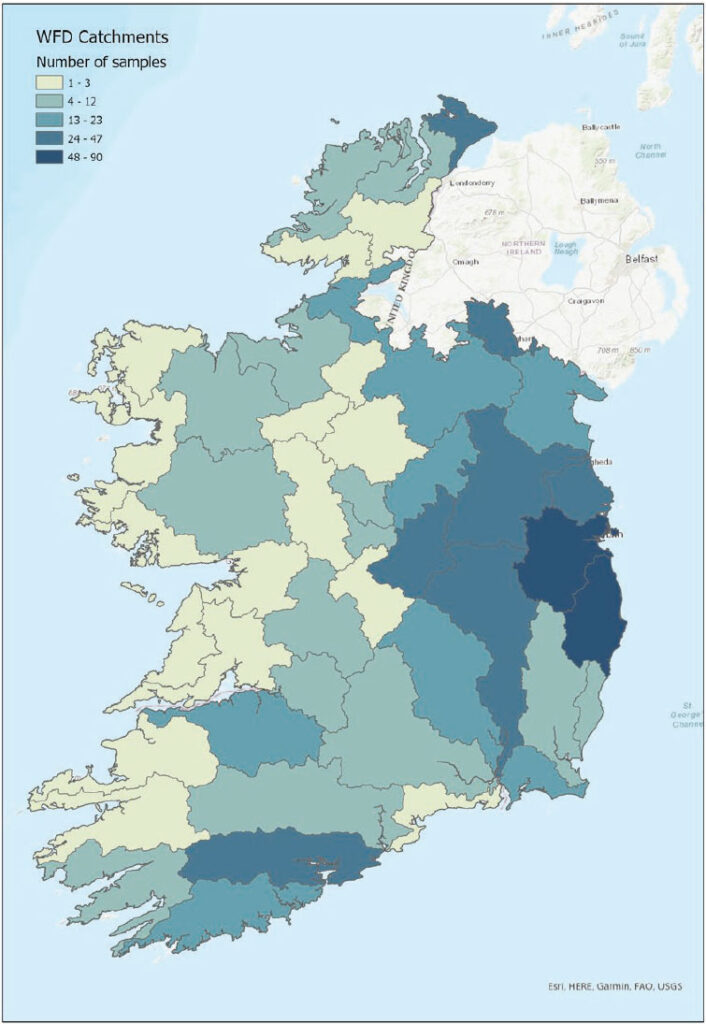
Figure 5. Number of WaterBlitz 2022 sampling sites within Water Framework Directive river catchments
The intensity of sampling during the WaterBlitz in catchments in the Greater Dublin Area and into the Barrow, the Upper Shannon, and the Lower Bann catchment, as well as the Lee and Bandon catchments in the south, will allow for greater analysis of the water quality in these catchments. The higher sampling rates in these catchments is also indicative of the number of community groups within these catchments that got involved in the WaterBlitz.
Nitrate Findings
Figure 6 below shows the ranges of nitrates measured over the course of the weekend of the WaterBlitz. Nitrate levels are higher in the southeast, where more intensive agriculture is practiced, and close to some urban areas – in particular Cork city and around Drogheda. Some of these areas are shown in Figure 7. In instances such as the river Lee, there is an increase in nitrate levels (and therefore a decrease in water quality) as the river approaches Cork city. The same can be observed as the river Delvin approaches Balbriggan in north county Dublin. In contrast to these areas, samples taken from freshwater sources on the Inishowen Peninsula in county Donegal show lower levels of nitrates. Over the coming months, this data will be further analysed.
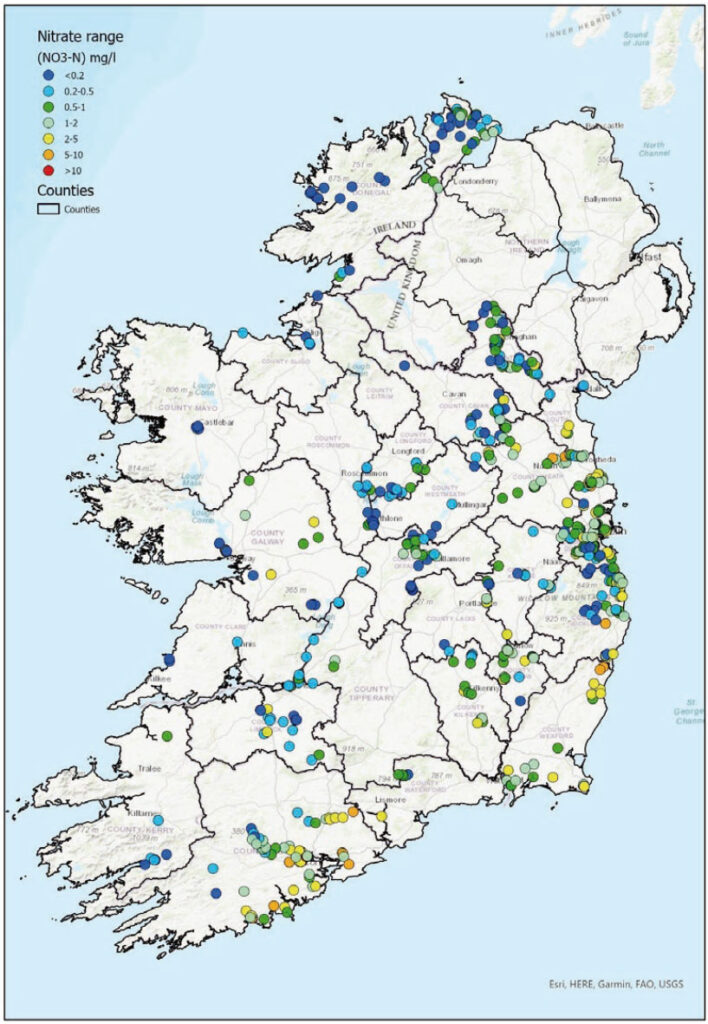
Figure 6. Nitrate ranges recorded across the country during the 2022 WaterBlitz
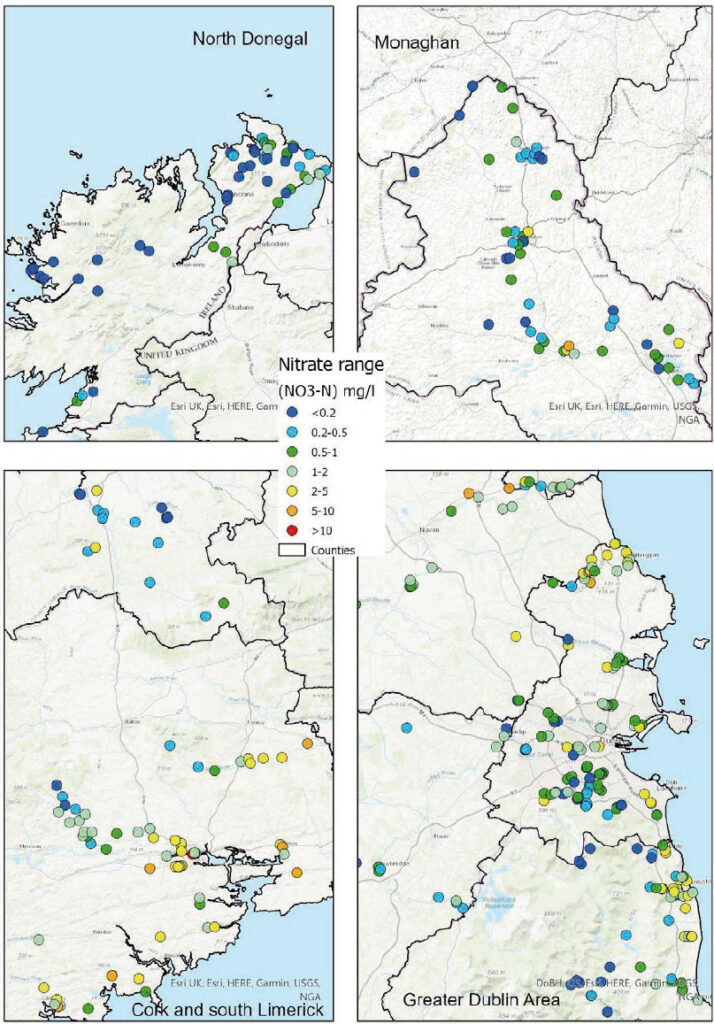
Figure 7. Closer look at nitrate ranges of samples at different locations during the Waterblitz.
Phosphate Findings
Levels of phosphate are seen in figures 8 and 9, and in many areas show a similar geography to nitrate levels. It is worthwhile pointing out that, as mentioned above, small changes in phosphate have a greater effect on algae growth. Therefore, any phosphate ranges greater than 0.05-0.1 mg/l PO4-P are indicative of lower quality water. Very high concentrations of phosphates were also recorded in Wexford, at Aughboy. This river has been identified as having high phosphate levels by the EPA.
The importance of your work can also be seen on the Delvin river, particularly where it flows through the Naul in north county Dublin, where high concentrations of phosphates were also recorded. These areas will be the focus of further research and analysis by the DCU Water Institute team.
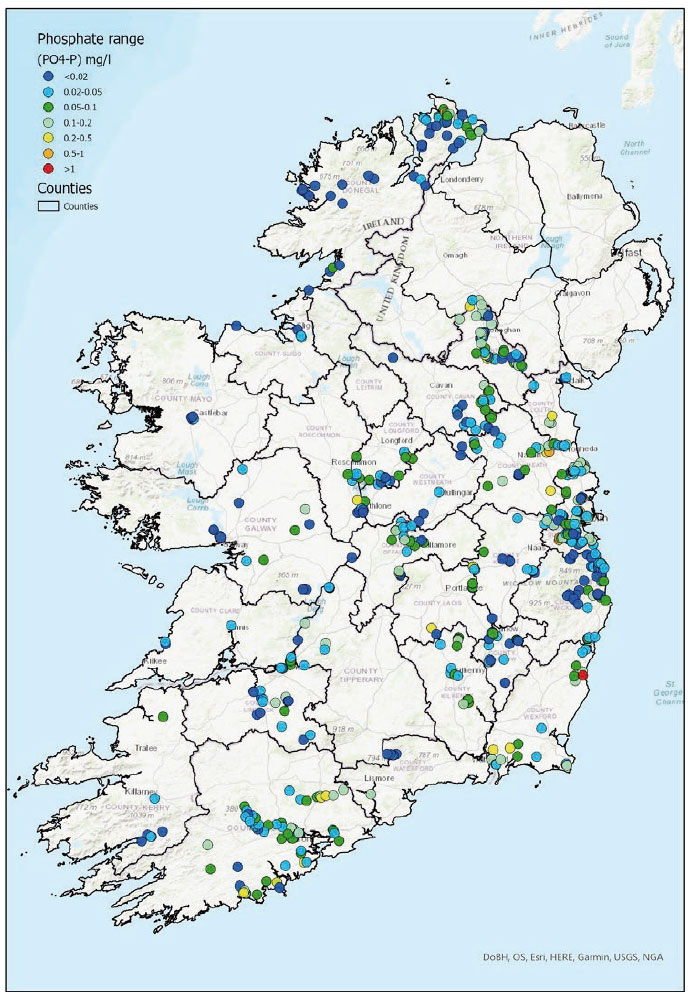
Figure 8. Phosphate ranges recorded across the country during the 2022 WaterBlitz.
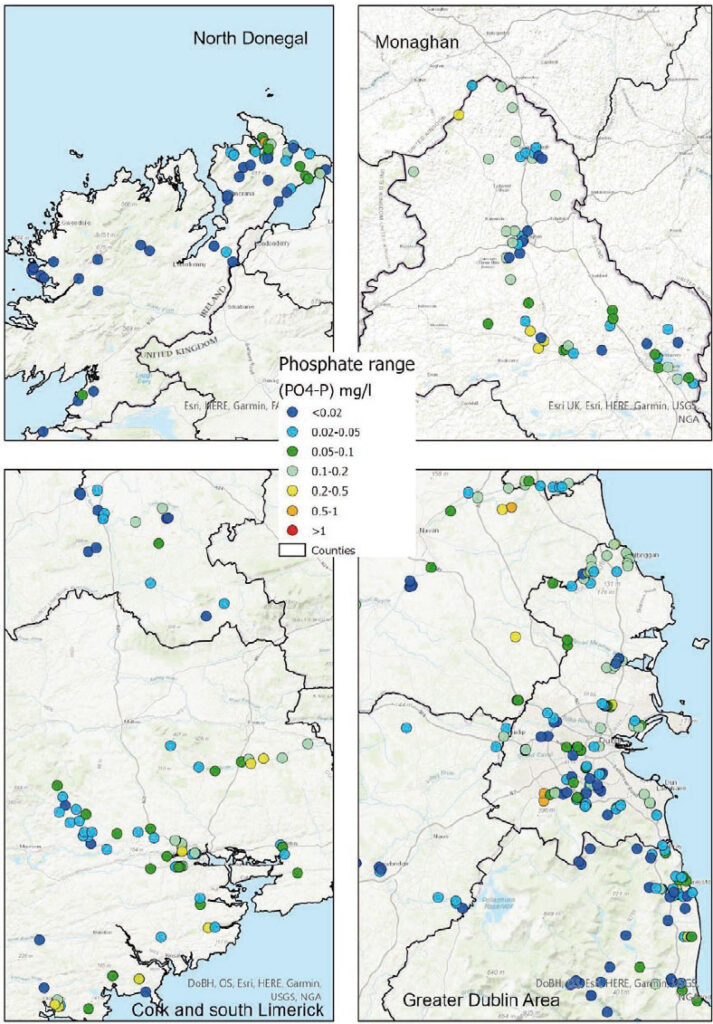
Figure 9. Closer look at phosphate ranges of samples at different locations during the Waterblitz.
This Waterblitz would not have been possible without the efforts of the many community groups. Figure 10 shows some of the communities that participated in this event.
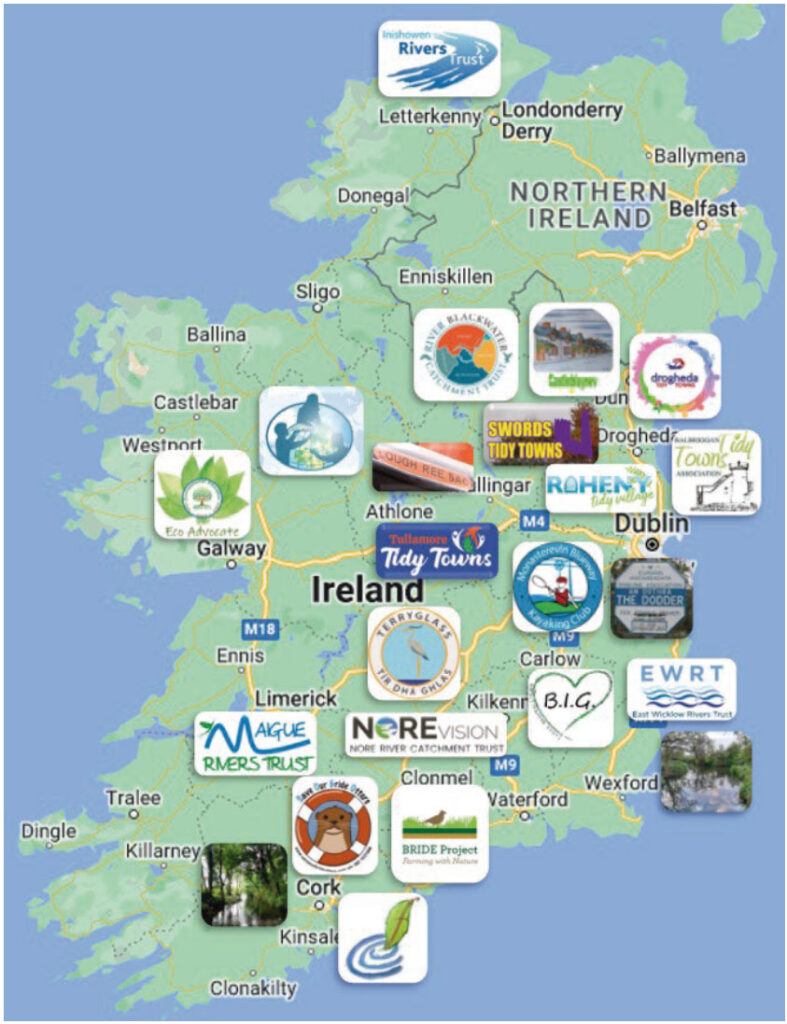
Figure 10. Some of the many groups located around the country who took part in the 2022 WaterBlitz.
Survey
We asked all WaterBlitz participants to complete a general survey after the Waterblitz. Here are some of the findings:
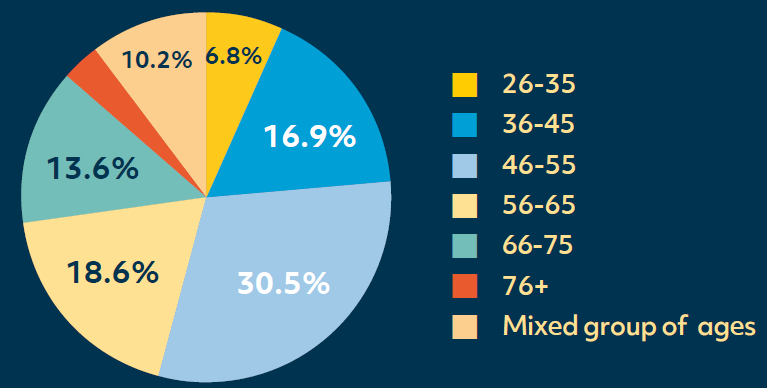
Figure 11. Age groups involved in the WaterBlitz. Data collected from survey at the end of the WaterBlitz.
The spread of age groups involved in the WaterBlitz shows that environmental monitoring is important to all age groups. A total of 17% of those who participated were from the older population, while 10.2% of people participated in a group with a mixture of ages. Given that many of the groups who participated were local community groups, which would include people of many ages from the local community, this is not surprising. It is noticeable that those of the 18-25 group either did not participate outside of a larger group, or did not complete the questionnaire. This is something we will investigate further.
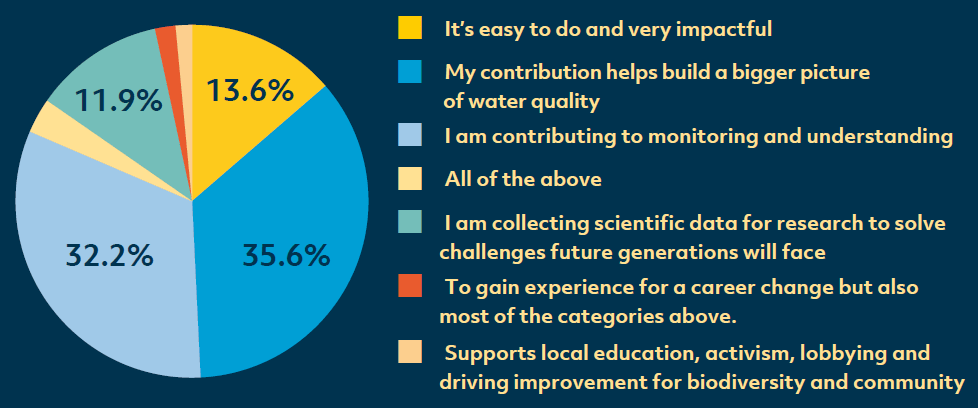
Figure 12. Why does citizen science interest people?
Most people who answered the survey referenced the importance of citizen participation in collecting data and monitoring water quality. This was interesting, as the primary motivation for citizen science was not simply educational, but people wanted to contribute to the scientific community and to make an impact with their contribution. In the DCU Water Institute, we have seen how local communities have become organised to take stewardship of their local freshwater resources. Citizen science can help them achieve this, and, when partnering with researchers, the data gathered can be analysed, enabling communities to tell a story about the local resource for impact.
I felt I was doing something positive to improve my local river which has been very poorly treated
Shared my love of nature with my daughter
Visiting streams and areas which I don’t often visit. Seeing the data coming in from around the country demonstrates that people do care about our rivers.
Time together as a family whilst contributing to a better understanding of the local water systems
Taking the learning of chemistry out of the classroom and make it “real” for my students.
Empowering us to help with the environment and educating my children
Just the involvement bringing a level of responsible citizenship to the students I teach in a real world practical manner
Feeling like I was partaking in a national effort to help the environment
The sense of contribution and hopefully increasing interest in water quality within our kayaking group.
Being out in the countryside and the feeling that I am contributing to society
What does the data say?
This year the DCU Water Institute team was astounded at the number of samples taken across the country. We thank you for your interest and participation. Every Citizen Scientist has played a role in growing our knowledge of water quality nationally, to help towards protecting our resources and ecosystems. With this information, we can identify areas of higher risk and help inform how these bodies of water can be protected.
We are very grateful for your enthusiasm and hope that you will participate in future events.
Our sincerest thanks to Dublin City University for supporting the Citizen Science activities of the Water Institute and the teams behind the scenes who work so hard to deliver our campaign.
Thanks also to Earthwatch Europe and FreshWater Watch for facilitating our involvement in this project. We would also like to thank Smart Dublin and Dublin City Council for sponsoring this project and who support our vision of collecting water quality results in real time. We would also like to sincerely thank Thomas Carolan and the team at LAWPRO, who also sponsored the project and connected us to a range of water groups across Ireland.
Report Authors:
Dr. Susan Hegarty – School of History and Geography, Water Institute
Prof Fiona Regan – Director Water Institute
Ruth Clinton – Water Innovation Manager
Anna Hayes, Citizen Science Officer
Date Published: 22nd March 2023