
Where does electricity fit in the equation? – Water, Carbon Footprint
The water‐energy nexus is the study of the connection between water and energy.
Rivers and groundwater, etc., are free public resources, but public water services (collecting this drinking water and supplying it to households) have a significant cost.
The cost of water varies from one country to the next, and even from one region to the next.
Electricity is needed in the network of water and wastewater operations. Electricity is a major contributor to the environmental impact of water supply and wastewater treatment. The operations include water abstraction, distribution, treatment, sewage transportation and wastewater treatment. The energy required for abstraction from the drinking water supply source, depends on whether the source is ground water or surface water.
Energy use in ground water abstraction is linear to the amount of lift (m) [1] that must be overcome to raise water, where the mean energy-intensity has previously been approximated as 0.004 kWh m−3 m−1 . In surface water abstraction, electricity use mainly depends on the distance and the local elevation profile, which has been estimated as 0.002–0.007 kWh m−3 km−1 using data from Spain, Australia and the United States according to Majid et al.
Within the water treatment plant itself, processes such as filtration, oxidation and ultraviolet treatment make up the major component of the energy demand at water treatment facilities. The energy requirements for these processes are also dependent on the local conditions. This cost in terms of energy required to generate treated drinking water, means that we need to consider carefully how we use this expensive product.
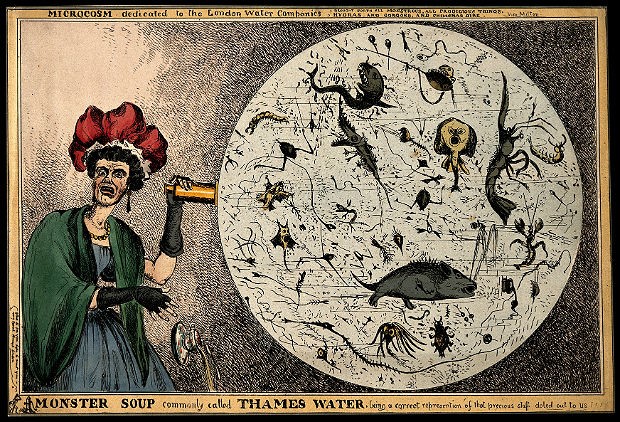
Factors like raw water quality and demand, can dictate the unit operations needed. This means also, that a more polluted water body (Monster Soup)[2] can cost more to treat for drinking water purposes, than a clean water. Therefore we also need to link water quality to the energy cost of water treatment. Consequently the carbon footprint of that resource is linked to how polluted the water body is.
[1] Aman Majid et al., Water 2020, 12, 225; doi:10.3390/w12010225
[2] “Monster Soup,” an 1828 political cartoon by British artist William Heath.